Last updated: October 30, 2026
Quick Answer: a crypto order book gives you a live view of bids, asks, spread, and visible liquidity, and on a liquid pair you can usually judge its near-term pressure in seconds. This guide to How to Read a Crypto Order Book explains the inside market, depth, and the limits of the screen without pretending it predicts the next trade.
Key Takeaways
- Read the book from the inside market outward, then check levels, size, and distance from price.
- Bid, ask, spread, and liquidity are the four terms that make the book readable.
- The biggest mistake is treating the order book like a fixed chart.
- The usual approach stops working when the screen no longer reflects stable resting interest.
A crypto order book shows pending buy and sell interest before a trade prints, and How to Read a Crypto Order Book starts with that live snapshot. If you can read it, you can often tell whether the market is leaning aggressive, thin, or balanced, but the result still depends on context and your own situation; if money decisions are material for you, speak with a qualified adviser.
What a crypto order book is, and who should use it

A crypto order book is the live list of limit orders on an exchange: bids are offers to buy at specific prices, asks are offers to sell at specific prices, and the spread is the gap between the best bid and the best ask. It is most useful for traders who already know how market and limit orders differ and who need to see current liquidity before acting.
This page assumes you already have an exchange screen open and know the basic layout of price, size, and time. It also assumes you understand that crypto markets can move quickly and that order books change second by second. On many venues, the order book only shows displayed orders, not hidden interest, and some markets use different display conventions. That matters because a book that looks thick on one exchange can look thin on another.
The order book is not a crystal ball. It shows resting interest, not certainty. A large bid at one price can disappear before a trade reaches it, and a wide spread can close in a second. The useful habit is to treat the book as a map of current pressure, then verify it against executed trades and the current chart. For general exchange mechanics, the hub on the crypto exchange page belongs above this topic, not instead of it.
A reader who should stop here and get specialist guidance is anyone making decisions with borrowed money, margin, or tax consequences they do not understand. The mechanics are straightforward; the consequences are not. Order-book reading does not replace tax, legal, or investment advice tailored to the person reading it.
How do you read a crypto order book?
You read a crypto order book by starting at the inside market, then working outward through price levels, size, and distance from the current price. The inside market is the best bid and best ask at that moment, in normal market conditions. What matters is not just the top line but whether liquidity is concentrated close to price or scattered in layers 1%, 2%, or more away.
| Term | What it means | Why it matters |
|---|---|---|
| Bid | Buy interest at a specific price | Shows where buyers are willing to rest |
| Ask | Sell interest at a specific price | Shows where sellers are willing to rest |
| Spread | Gap between best bid and best ask | Indicates execution cost and liquidity |
| Liquidity | How much size can absorb orders | Shows how easily price may move |
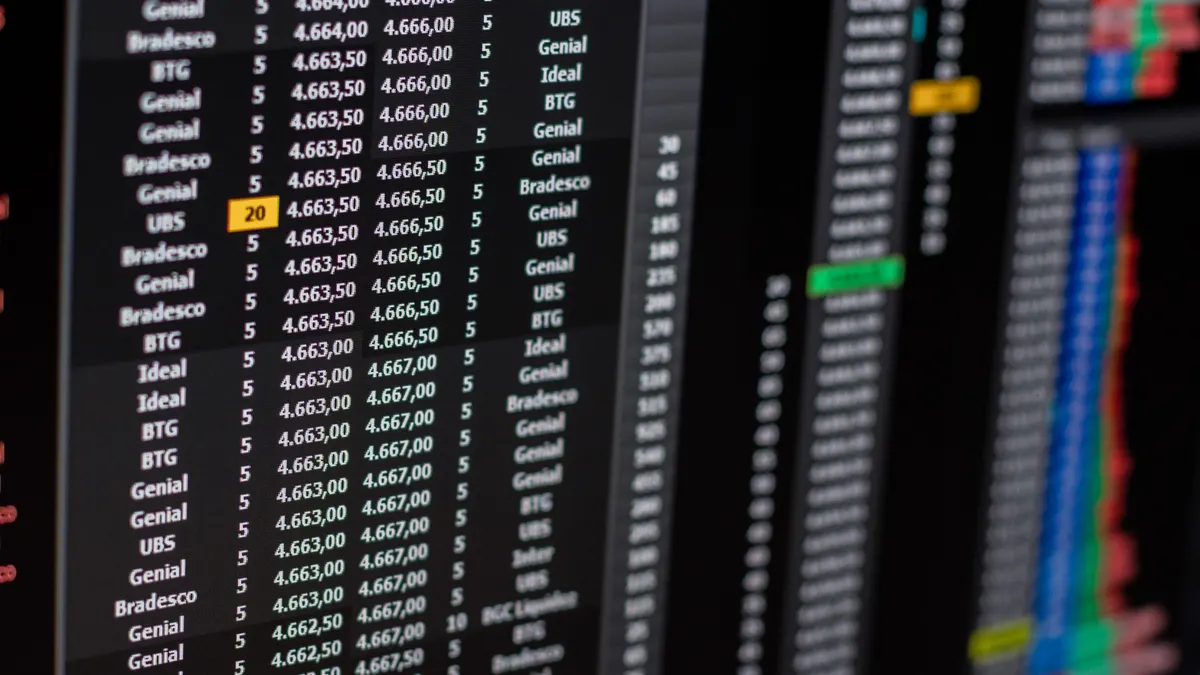
- Identify the best bid and best ask first. The best bid is the highest current buy price; the best ask is the lowest current sell price. Verify that the bid is below the ask and that both are the closest prices to the mid-market area. If the screen shows crossed quotes or a stale timestamp, the feed is unreliable.
- Measure the spread. The spread is the difference between best ask and best bid, often shown as a price gap or percentage. Check whether it is narrow or wide relative to the market’s usual state on that venue. A spread that looks normal on one pair can be large on another; if the gap jumps suddenly, liquidity may have thinned.
- Read size at each level, not just the top of book. Size is the quantity resting at each price. Scan at least the first 5 to 10 levels on both sides. Verify whether orders are clustered at round numbers such as 50,000 or 0.5000, which often act as visible reference points. If one side is almost empty beyond the first level, the market can move through it quickly.
- Look for market depth. Market depth means how much size sits across multiple levels before price moves materially. Compare the stacked bids and asks over a band such as 0.5% to 2% from the current price, depending on the pair’s volatility. If the book is deep on both sides, price may need more trading pressure to move; if depth is thin, even modest orders can push it.
- Check the balance between bids and asks. More visible size on the bid side suggests buy interest; more on the ask side suggests sell interest. Verify whether that imbalance persists across several price levels, not only at the top. If the imbalance exists at one level only, it may be a small wall rather than broad support or resistance.
- Watch for walls and gaps. A wall is an unusually large cluster of resting orders at one price; a gap is a section with very little size. Check whether the wall is repeated across multiple refreshes. If it vanishes after the screen updates, it may have been pulled, which means it was not dependable support or resistance.
- Cross-check with recent trades. Most books sit beside a time-and-sales feed or recent executions list. Verify whether aggressive buyers are hitting asks or aggressive sellers are hitting bids. If the book looks bullish but trades keep printing through bids, the visible book is not holding price.
- Re-read the book after a small time interval. Wait 5 to 30 seconds, depending on the pair’s pace, and compare the same levels again. Verify what stayed, what moved, and what disappeared. If the entire book shifts every refresh, you are looking at a fast market where snapshot reading matters less than order flow.
The point is not to predict a single next tick. It is to know whether the market currently has shallow air pockets, heavy resting interest, or a narrow gap that can be crossed with little effort. A book that looks orderly but keeps changing every few seconds is telling you that the visible levels are only temporary.
What bid, ask, spread, and liquidity tell you
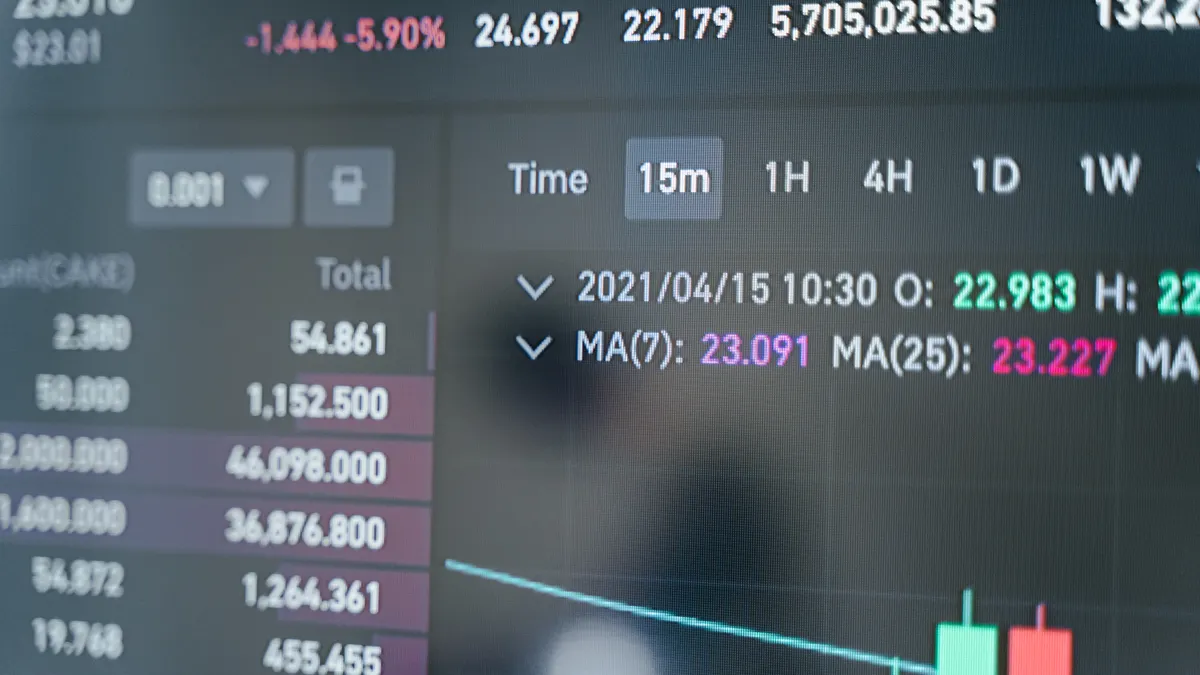
Bid, ask, spread, and liquidity are the four terms that make the order book readable instead of decorative. The bid is demand, the ask is supply, the spread is the cost of crossing from one side to the other, and liquidity is how easily the market can absorb orders without large price movement.
The first clue is the spread. A tighter spread usually means the market is easier to enter and exit at close prices, while a wider spread often means less active interest or a more uncertain moment. That does not make the market good or bad on its own; it just changes execution quality. In a book with a 1-tick spread, a market order may fill near the quoted price. In a wider book, the same order can move into worse prices faster.
Liquidity is the next clue. Visible liquidity near the spread can make the book feel stable, but only if it is genuine and not fleeting. Deep liquidity across several levels tends to absorb pressure better than a single large order. Thin liquidity means a small wave of buying or selling can move the price more than a casual observer expects.
A useful habit is to compare the book shape. If bids stack steadily below price and asks thin out quickly above it, the market may have stronger visible support than resistance. If the opposite is true, the book may be leaning the other way. Yet the visible imbalance is only one layer of evidence. A book can show heavy bids and still fall if sellers are more aggressive.
Do not confuse size with certainty. A 1,000-unit order at one level does not guarantee anything if it can be canceled instantly. This is why traders watch the book together with executed trades. The book shows intent; trades show commitment. On a moving market, that difference matters more than any single number on the screen.
The mistakes people make when reading the book
The biggest mistake is treating the order book like a static chart. It changes continuously, often every second, so one snapshot can mislead you. The consequence is obvious: you can mistake a temporary wall for durable support. The correct alternative is to compare several refreshes over 5 to 30 seconds and see whether the same levels persist.
Another common error is focusing only on the top bid and ask. That misses the depth behind the first line and can hide a thin market underneath a narrow spread. The consequence is slippage or a price move that feels sudden but was visible lower down in the book. The correct alternative is to inspect multiple levels on both sides, not just the inside market.
A third error is reading large visible orders as honest commitment. Large orders can be canceled, reduced, or shifted. The consequence is false confidence in a level that disappears when approached. The correct alternative is to look for repeat appearance across updates and to check the recent trade tape for actual execution near that level.
A fourth mistake is ignoring the spread. People see a bid wall and think the market is strong, then forget that a wide spread can still make execution costly. The consequence is paying more than expected to get in or out. The correct alternative is to judge the spread alongside depth and recent volatility, especially on less liquid pairs.
A fifth error is assuming all exchanges show the same book. Different venues can have different liquidity, different participants, and different order-routing behavior. The consequence is reading one venue as if it represented the entire market. The correct alternative is to remember that the book is venue-specific unless you are looking at a consolidated feed, which many retail screens are not.
When the usual order book reading stops being useful
The usual approach stops being useful when the screen no longer reflects stable resting interest. In those moments, the book is still real, but it is the wrong tool for the decision in front of you.
Very fast markets: The visible book can change before you can interpret it — use recent trades and wider context instead of relying on a single snapshot.
Thin pairs: A small number of orders can distort the picture — expect gaps, slippage, and false walls, and do not read one level as if it were a trend.
Exchange outages or feed delays: The information may be stale — avoid treating the book as current until the feed catches up and the timestamps look normal.
Crossed or obviously inconsistent quotes: The display may be malfunctioning or out of sync — do not act on a book that shows impossible pricing.
Order books with frequent spoof-like behavior: Large orders appear and vanish without trading — treat visible walls as tentative and verify with executed volume.
Major news events: The book can empty out or reprice in seconds — the visible depth may not survive the next headline, so use extra caution and smaller assumptions.
When any of these appear, the consequence is the same: the book becomes a poor guide to near-term execution. The right response is to slow down, check the feed quality, and use additional evidence rather than forcing a read from a screen that is no longer orderly.
How limit orders appear in an order book
Limit orders appear in an order book as resting instructions at a chosen price, and they stay there until they are filled, canceled, or expire. If you place a buy limit below the current ask, it shows up on the bid side. If you place a sell limit above the current bid, it shows up on the ask side.
The first thing to verify is whether the order is at the exact price level you expect. Many books group orders by price increments, so the display may show aggregated size at 0.10, 0.01, or another tick size depending on the market. That grouping matters because a single line can represent several separate orders. If the price increment is coarse, the screen may hide detail that exists just off the visible line.
Limit orders are central to understanding depth because they are what make the book visible in the first place. A market order usually removes liquidity; a limit order usually adds it. That is why a book can look full on one side and still move quickly if aggressive orders keep hitting the other side. The visible stack is not a promise, only resting interest.
A limit order that sits far from the current price may remain invisible in practical terms until the market moves toward it. A limit order placed close to the spread may interact quickly and change the top of book. This is one reason many readers should not equate large displayed size with immediate tradability. The order may be there, but not necessarily actionable at the moment they want it.
What a good read looks like on a live screen
A good read is one where the book, the spread, and the recent trades all tell the same story. If bids are stacked below, asks thin out above, the spread is modest, and recent prints are bouncing between both sides, the book is balanced enough to read as a live market rather than a broken one. That does not mean the price will move in a certain direction.
The practical standard is consistency. On a liquid pair, the spread should not jump wildly from refresh to refresh without a reason, and the same depth levels should not vanish instantly every time you look. On a thinner pair, you should expect less consistency and more empty space between levels. A spread of a few ticks on a major pair may be normal; on a thin altcoin, even a small spread can hide poor execution quality.
The reader’s job is to separate structure from noise. Structure is repeated depth, a normal spread, and trades that respect the visible book. Noise is a wall that appears once, a gap that closes instantly, or a book that looks deep but evaporates on contact. If the screen remains unclear after 2 or 3 refreshes, the honest conclusion is that the book is not giving a clean signal.
That is the right stopping point for most people. The screen should help you understand liquidity and order pressure, not push you into acting on guesswork. If the book does not make the market clearer, it is telling you something useful: wait for better information.
How to use the book without overreading it
Use the order book as a short-term execution map, not as a full market forecast. Start with the best bid and ask, measure the spread, scan 5 to 10 levels for depth, and compare what stays visible across several refreshes. Then check recent trades to see whether buyers or sellers are actually hitting the other side.
The best habit is to ask one question: does the visible liquidity look durable enough to matter for the next few minutes? If the answer is unclear, the book is not wrong; it is simply incomplete. For a deeper exchange walkthrough, see the exchange guide, the limit order guide, and the market order guide on this site, then compare them with the live book you are watching. If the answer is yes, the book may help with timing, but the final decision still depends on the broader market and, when appropriate, professional advice.
For more on market mechanics, the crypto exchange page, the limit order page, and the market order page can help you connect the screen to execution choices. For an external reference on order-book structure, see the Nasdaq glossary page on the order book and the CFTC’s educational materials on market structure.
Drafted with AI; not yet reviewed by a person.